
Deliverability and Revenue: How Inbox Placement Impacts the Bottom Line
April 9, 2020

Email is hands down the most lucrative marketing channel, averaging a 145% ROI. Over the years, Marigold Engage by Sailthru has written numerous ebooks about how to capitalize on it, zeroing in on strategies such as personalization and behavior-based triggered messages. However, your email marketing program can only have an incredible impact on your brand’s bottom line if people are actually receiving your messages. Deliverability and revenue have a much more symbiotic relationship than many marketers realize.
Every day, people receive more than 293 billion emails, less than 0.01% of the number of emails actually sent. Concerned with protecting users’ inboxes first and foremost, Internet Service Providers (ISPs) mark the overwhelming majority of email as malicious spam, blocking it out right. ISPs err on the side of caution and cast a wide net, giving the same treatment to any email that appears to have similarities with spam.
According to Return Path’s 2018 Deliverability Benchmark Report, the average Inbox Placement Rate is 85%. That’s an increase over previous years, but it still means that if you have 15% of your messages are being marked as spam or disappearing into the void.
Deliverability and Revenue: A Hypothetical
Here’s a hypothetical to illustrate the relationship between deliverability and revenue. Say you send an email to 100,000 subscribers. You can reasonably expect 15,000 of those messages to be marked as spam or disappear into the void.
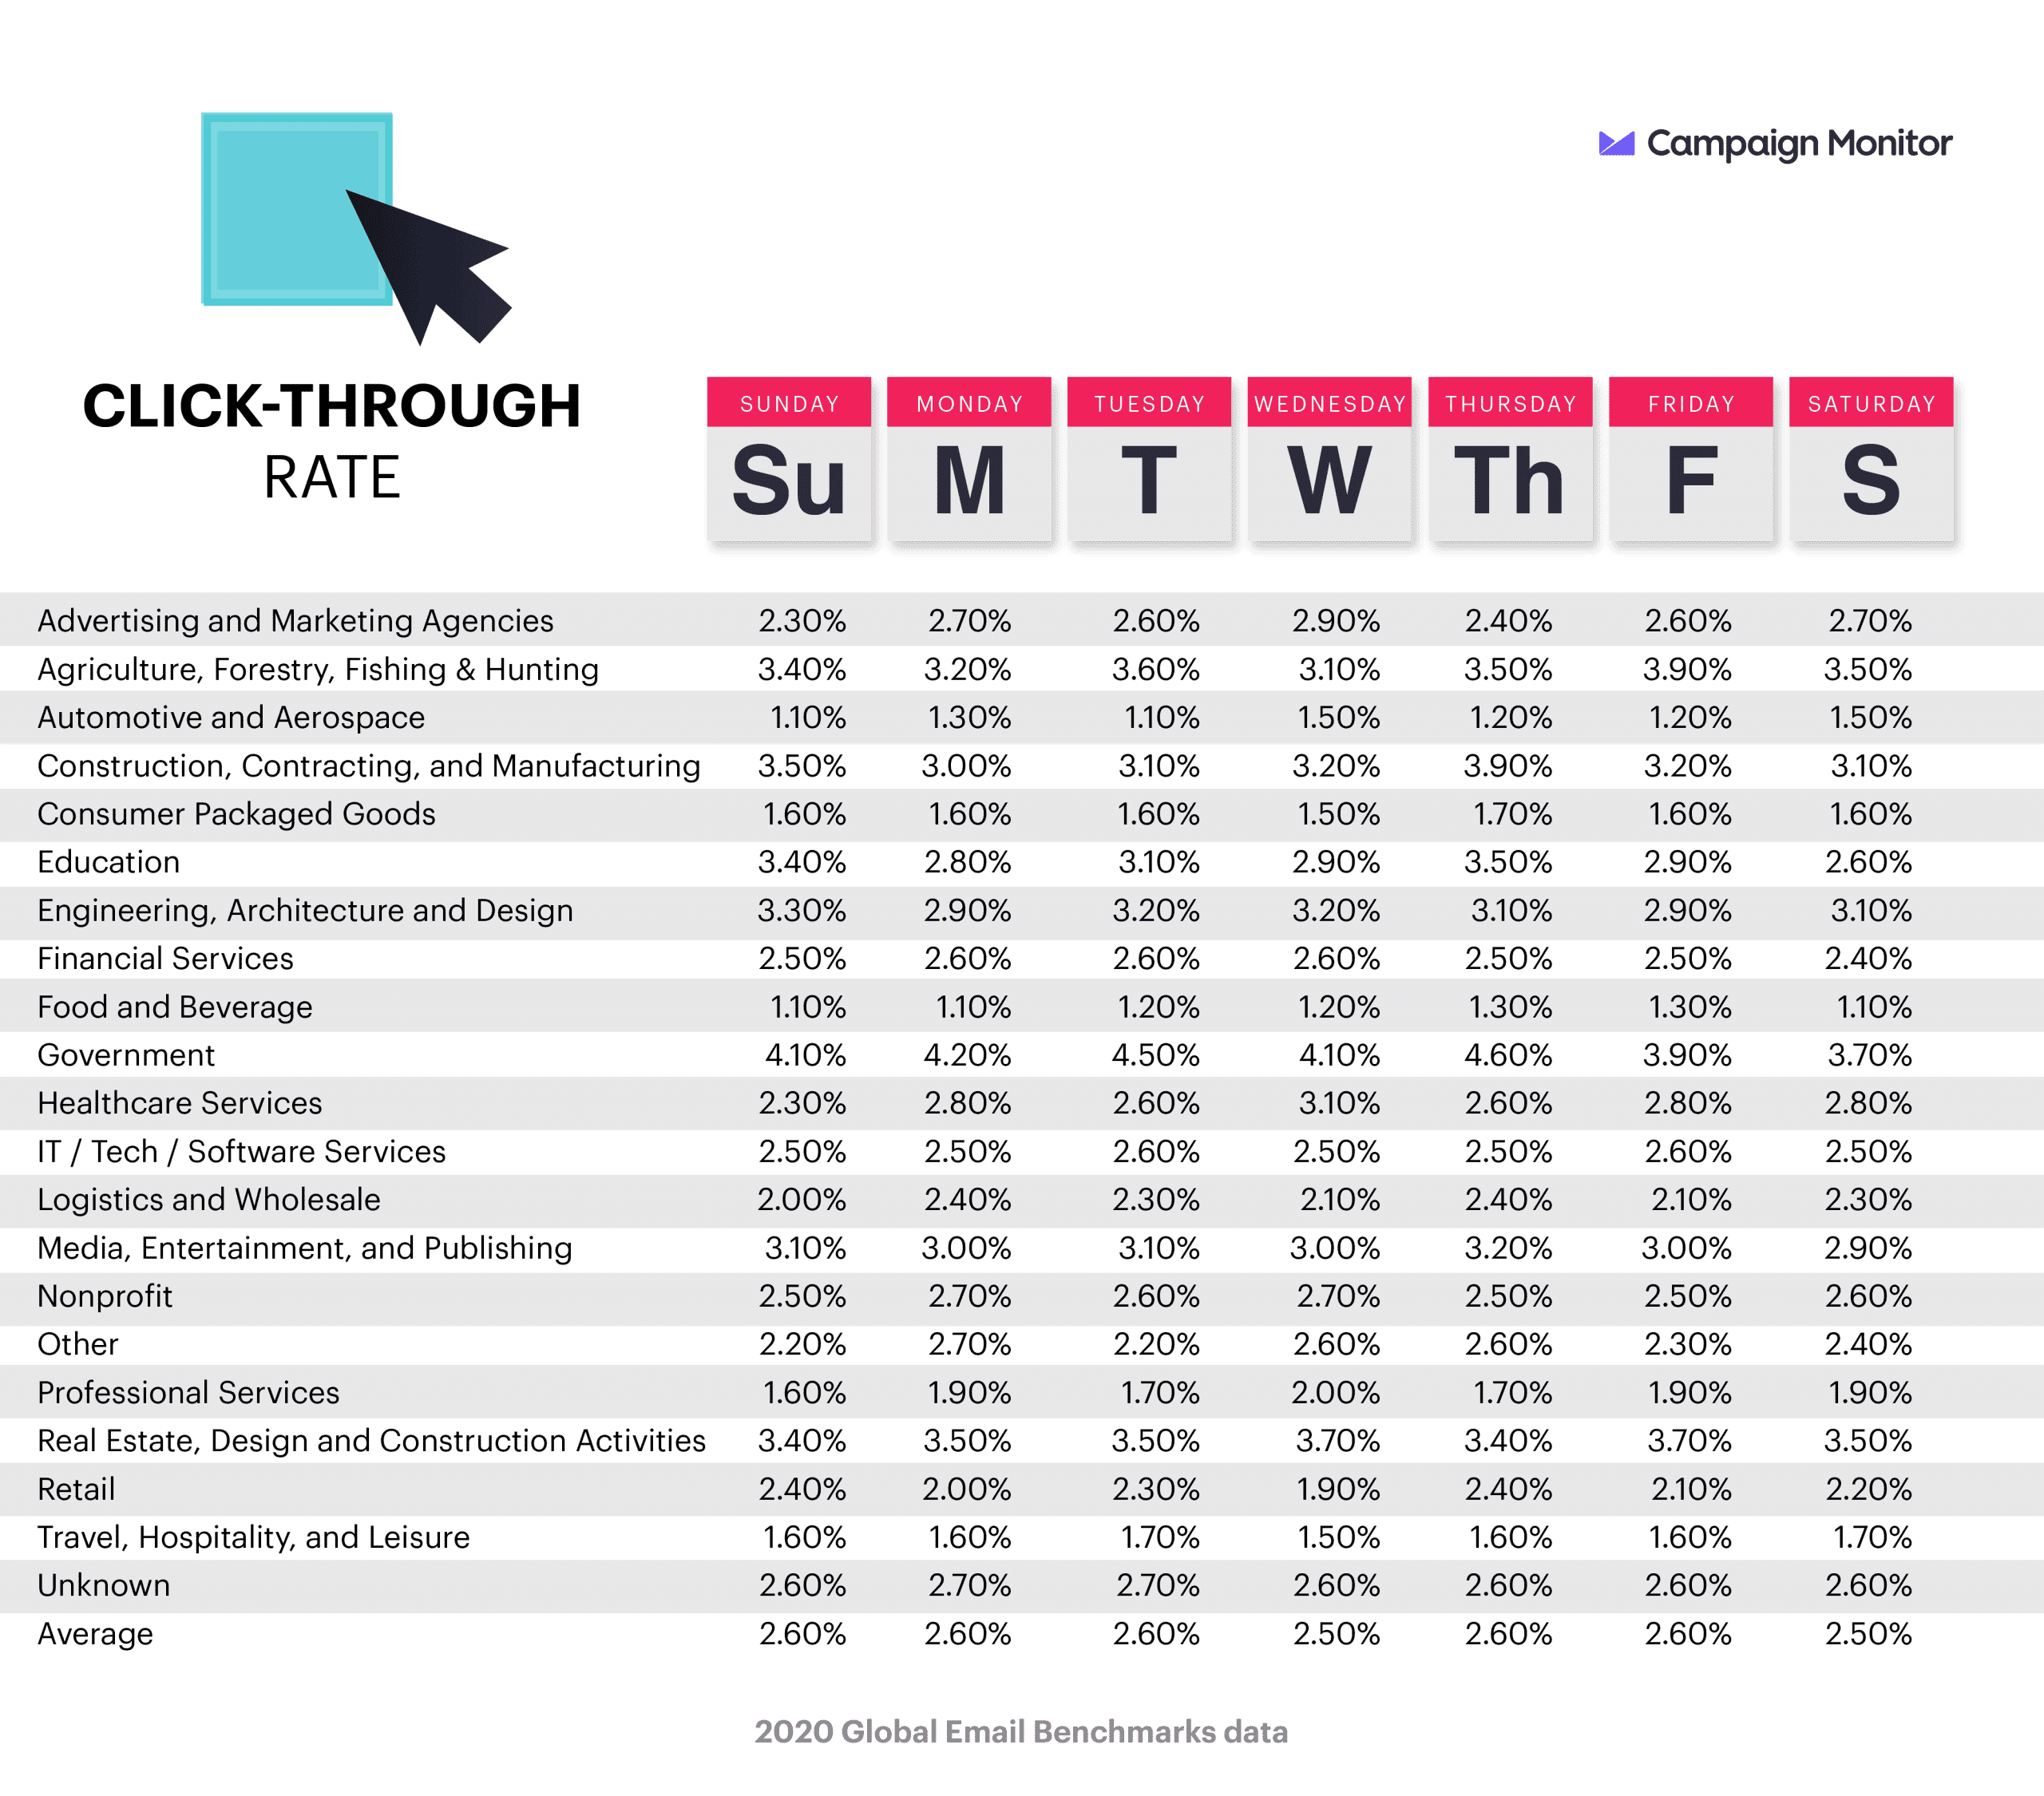
Earlier this year, our sister brand Campaign Monitor analyzed billions of emails in order to determine a series of benchmarks for different industries and even days of the week. The average clickthrough rate is 2.6% for retailers. Those numbers mean that for every 85,000 emails delivered, you have an average of 2,210 potential customers.
Two years of Barilliance data found that email conversion rate is on the rise, with 17.75% of clicked-through emails resulting in a purchase last year. From 2,210 potential customers, that means 392 sales. If your average order value is $150, you just made $58,800.
Now say you get your Inbox Placement Rate up a single percentage point. Using the same math, you have 26 more potential customers, five more sales and $750 more in revenue. That doesn’t sound like much, but remember, that’s just one email.
Deliverability and Revenue: The Reality
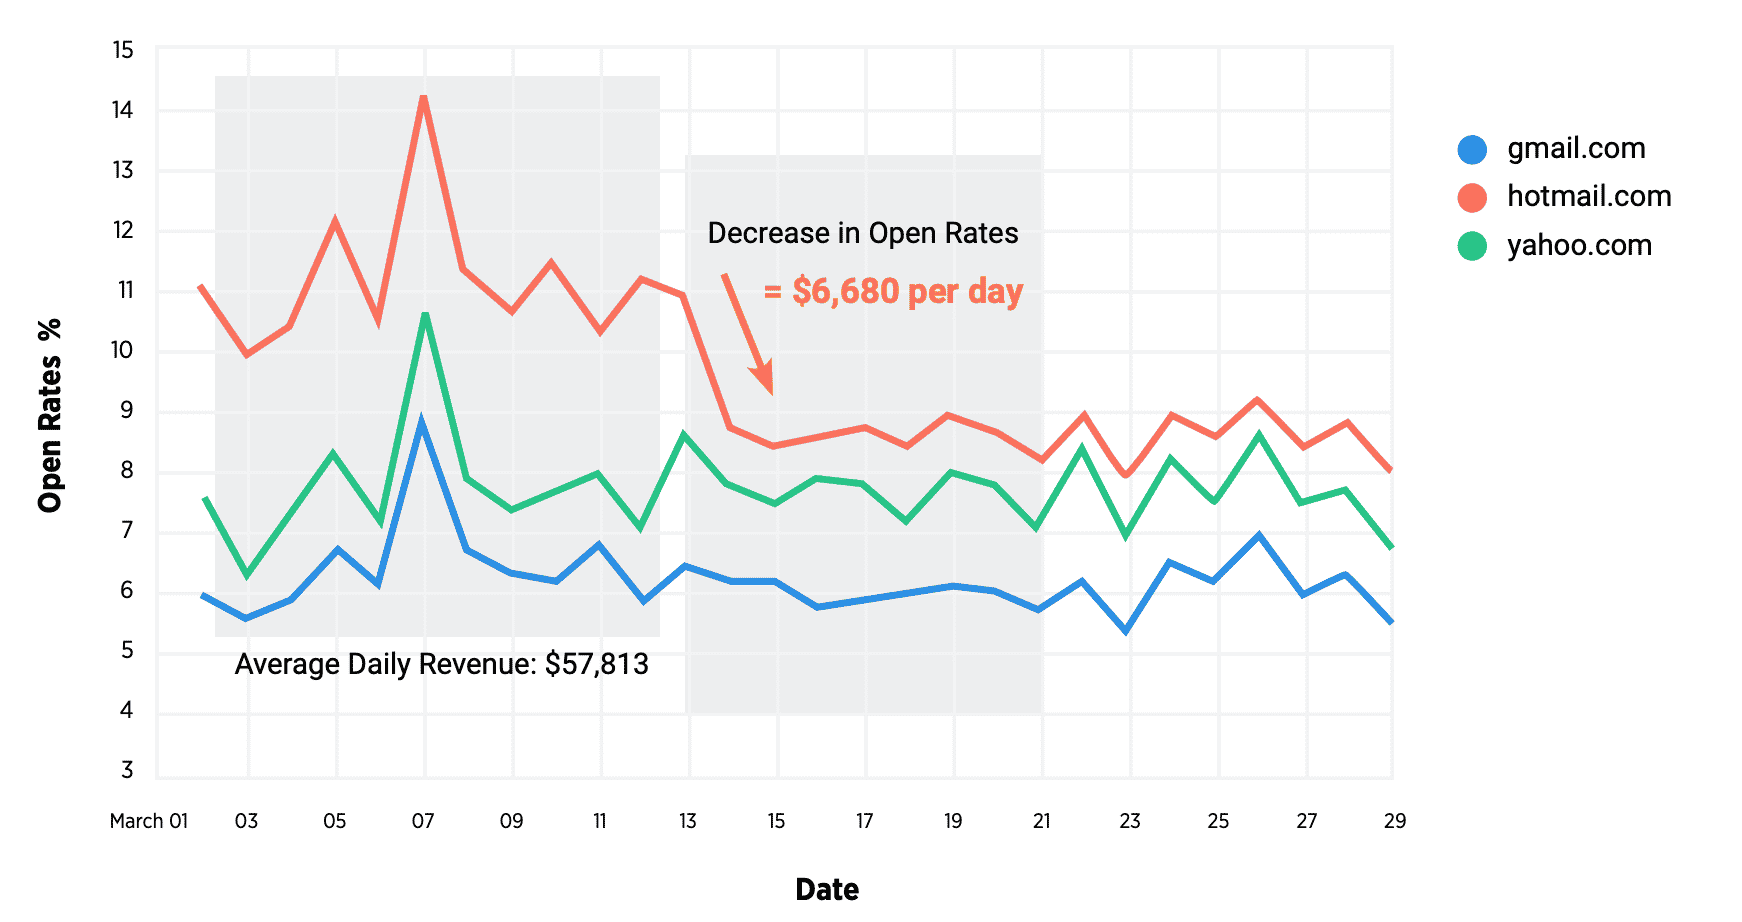
Here’s a real example from a Sailthru customer, demonstrating how deliverability and revenue work together. Analyzing the company’s open rates throughout March, we found its average daily revenue is $57,813. A mid-month decrease in open rates resulted in $6,680 in daily lost revenue.
Our ebook, Delivering Results to the Inbox, covers far more than deliverability and revenue. Click here to download the guide to learn more about the complex path to the inbox, sender reputations, permission practices, and more.
The State of Brand Loyalty in the U.S. in 2023
Related